Open any audio tool and you see decibels: on a mixer's faders, on a spectrogram's colour bar, in a codec's SNR, in a phone's “prediction gain”. The decibel is not a unit of
anything. It is a way of writing ratios, a logarithmic ruler. This page explains why that ruler fits audio so well, from three points of view: the
ear (loudness), the spectrum (seeing quiet detail next to loud peaks), and the engineer (errors, gains and budgets). It ends
with the traps that catch everybody once.
Ask “how much louder is a rock concert than a whisper?” and the honest answer is a ratio: the concert's sound pressure is about 10 000 times larger, and its power about
100 million times larger. Ratios like these are awkward to write, compare and add. The decibel takes the logarithm of the ratio, so that multiplying becomes adding:
$$L = 10\log_{10}\frac{P}{P_0}\ \text{dB} \qquad\text{(for powers or energies)}$$
\(P_0\) is a reference. A decibel value always means “this many dB relative to something”. One bel (after Alexander Graham Bell) is a factor of 10 in power, which proved too coarse, so engineers used tenths of a bel.
The 10-versus-20 puzzle
Audio signals are usually amplitudes (a pressure, a voltage, a sample value), not powers. Power grows with the square of amplitude, \(P \propto A^2\), so the same ratio written with amplitudes needs a 20:
$$L = 10\log_{10}\frac{A^2}{A_0^2} = 20\log_{10}\frac{A}{A_0}\ \text{dB}$$
Both formulas give the same number of decibels for the same physical change. Use 10 with powers and energies (\(|X|^2\), \(\sum x^2\), intensity), and 20 with amplitudes (\(|X|\), \(x\), pressure, voltage).
change
power ratio
amplitude ratio
+3 dB
\(\times 2\)
\(\times 1.41\)
+6 dB
\(\times 4\)
\(\times 2\)
+10 dB
\(\times 10\)
\(\times 3.16\)
+20 dB
\(\times 100\)
\(\times 10\)
+60 dB
\(\times 1\,000\,000\)
\(\times 1000\)
0 dB
\(\times 1\) (no change)
\(\times 1\)
−6 dB
\(\times \tfrac14\)
\(\times \tfrac12\)
Three properties make this ruler useful, and each of the next three sections leans on one of them:
📏
Huge ranges, small numbers
A factor of a trillion in power is just 120 dB. Tiny and enormous values fit on one axis.
➕
Products become sums
\(\log(ab) = \log a + \log b\). Gains in a chain, and source \(\times\) filter, simply add.
⚖️
Equal steps are equal ratios
Going from 1 to 2 and from 100 to 200 are both +3 dB (in power). That matches how we perceive change.
Converter: drag the decibels
Amplitude drawn to scale: grey = reference, blue = after the change (clipped at the right edge when it is too big to draw).
02 · The ear's view
A million-to-one range, heard in ratios.
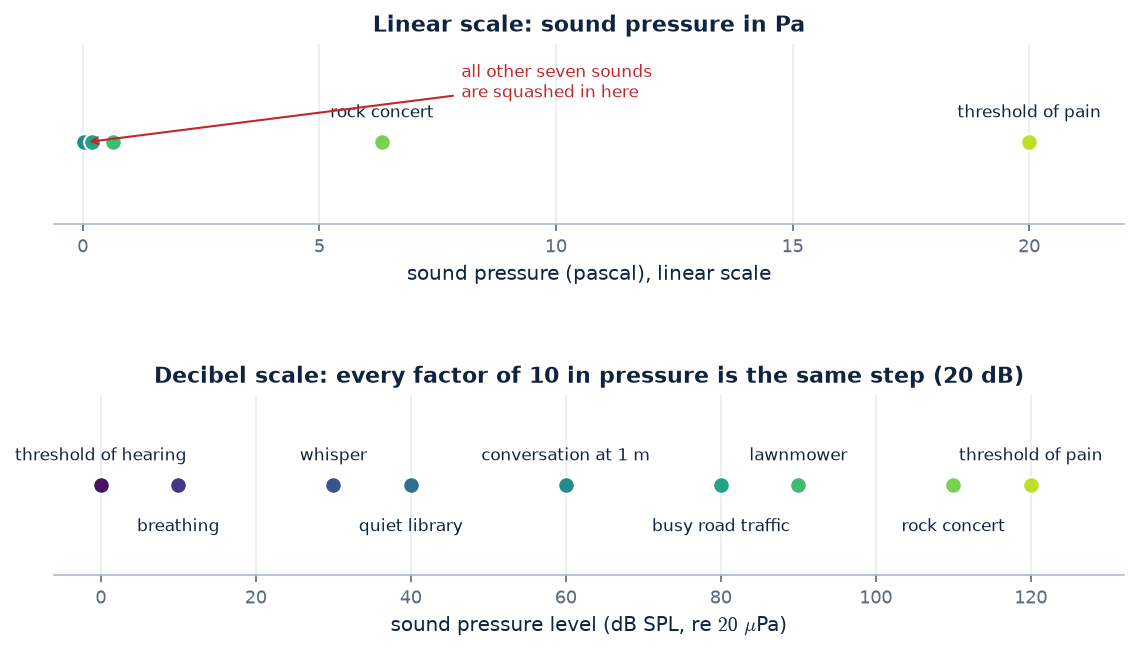
The quietest sound a young listener can hear at 1 kHz has a pressure of about \(20\ \mu\text{Pa}\), a fluctuation of two ten-billionths of atmospheric pressure. The threshold of pain is
around \(20\ \text{Pa}\). That is a factor of a million in pressure (a million million in power), and the ear handles all of it. On a linear axis almost every
everyday sound is crushed against zero:
Figure 1. Typical levels of everyday sounds (rounded, commonly quoted values). Top: sound pressure on a linear axis; everything quieter than a rock concert is a dot near zero. Bottom: the
same sounds in dB SPL, \(L_p = 20\log_{10}(p / 20\,\mu\text{Pa})\). Every factor of 10 in pressure is the same 20 dB step, and the sounds spread out evenly.
We hear ratios, not differences
In the 1830s Ernst Weber noticed that the smallest change in a stimulus that people can detect is a fixed fraction of the stimulus, not a fixed amount. Gustav Fechner turned
this into a law: if every just-noticeable step is the same ratio, then perceived magnitude grows with the logarithm of the stimulus. For sound intensity, the just-noticeable
change is roughly 1 dB (about 0.5–1 dB for broadband sounds at comfortable levels) whether the sound is quiet or loud. A decibel scale therefore makes
equal steps on paper close to equal steps for the ear.
Later, Stanley Smith Stevens measured loudness directly by asking listeners to judge “twice as loud”. He found loudness grows roughly as a power law of intensity,
\(N \propto I^{0.3}\). In decibels that has a neat consequence:
$$+10\ \text{dB} \;\Rightarrow\; I \times 10 \;\Rightarrow\; N \times 10^{0.3} \approx N \times 2$$
the rule of thumb “+10 dB sounds about twice as loud” (it holds roughly, at moderate levels around 1 kHz). Ten times the power is needed to sound twice as loud, which is why a 100-watt amplifier is not ten times louder than a 10-watt one.
Listen: the same phrase at different levels
Start with your volume low and raise it until the 0 dB version is comfortable. All the other buttons are quieter.
Two staircases: equal steps in amplitude vs equal steps in decibels
Each staircase plays five short bursts of the phrase, getting louder. Linear adds the same amount of amplitude each time (0.2, 0.4, 0.6, 0.8, 1.0); decibel multiplies by
the same factor each time (+6 dB, so each burst is twice the amplitude of the last). Which one sounds like an even climb?
Bar height = amplitude of each burst. The numbers above the bars are the step from the previous burst, in dB.
The linear staircase makes a big jump at the start (+6 dB) and then almost stalls (+1.9 dB at the end), while the decibel staircase climbs evenly. This is the practical reason why
every volume knob, fader and gain control in audio is marked in dB, and why loudness is quoted on a decibel scale.
Many references, one idea
A decibel value needs a reference. In audio you will meet several, and the suffix tells you which:
written
reference (0 dB)
where you see it
dB SPL
\(20\ \mu\text{Pa}\) sound pressure, roughly the threshold of hearing
acoustics, noise regulations, hearing safety
dB(A)
dB SPL after an “A-weighting” filter that reduces low and very high frequencies, as the ear does at moderate levels
noise meters, workplace and traffic limits
dB HL
the average normal hearing threshold at each frequency
audiograms (hearing tests)
dBFS
digital full scale: the largest value the samples can hold
recording software, codecs; always \(\le 0\) for a clean signal
dB (plain)
another signal: the input, the noise, the original
gain, attenuation, SNR, prediction gain
03 · The spectrum's view
Seeing the quiet next to the loud.
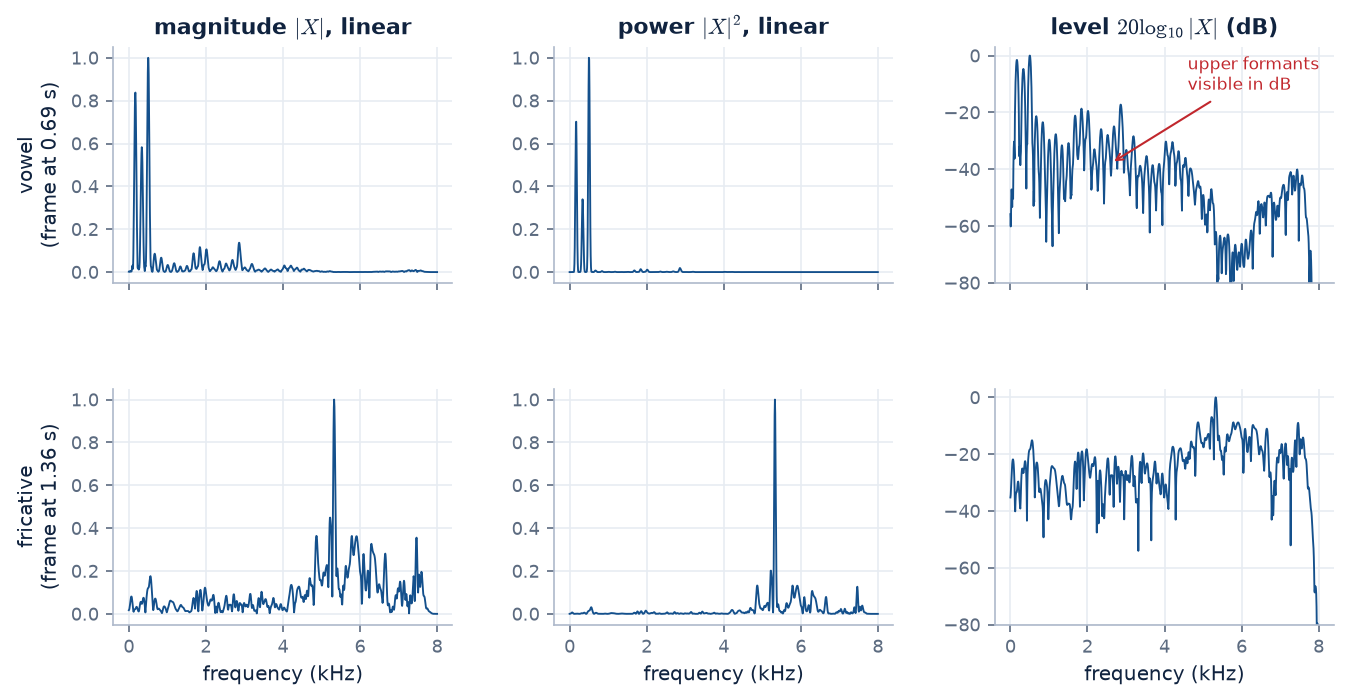
A voiced speech spectrum has strong low harmonics and weak high formants. The difference is easily 40–60 dB, a factor of 100–1000 in amplitude. On a linear axis the weak parts
are invisible, even though the ear hears them clearly and they carry much of the information (F2 and F3 tell vowels apart, and fricatives live up there).
Figure 2. One 32 ms frame of a vowel and one of a fricative from our recording, drawn three ways. On the linear magnitude and power axes the vowel looks like
“three spikes below 600 Hz”: in this frame only 3.8% of the power lies above 1 kHz. In decibels the formant peaks at 2–4 kHz appear,
and so does the fricative's broad hiss above 4 kHz.
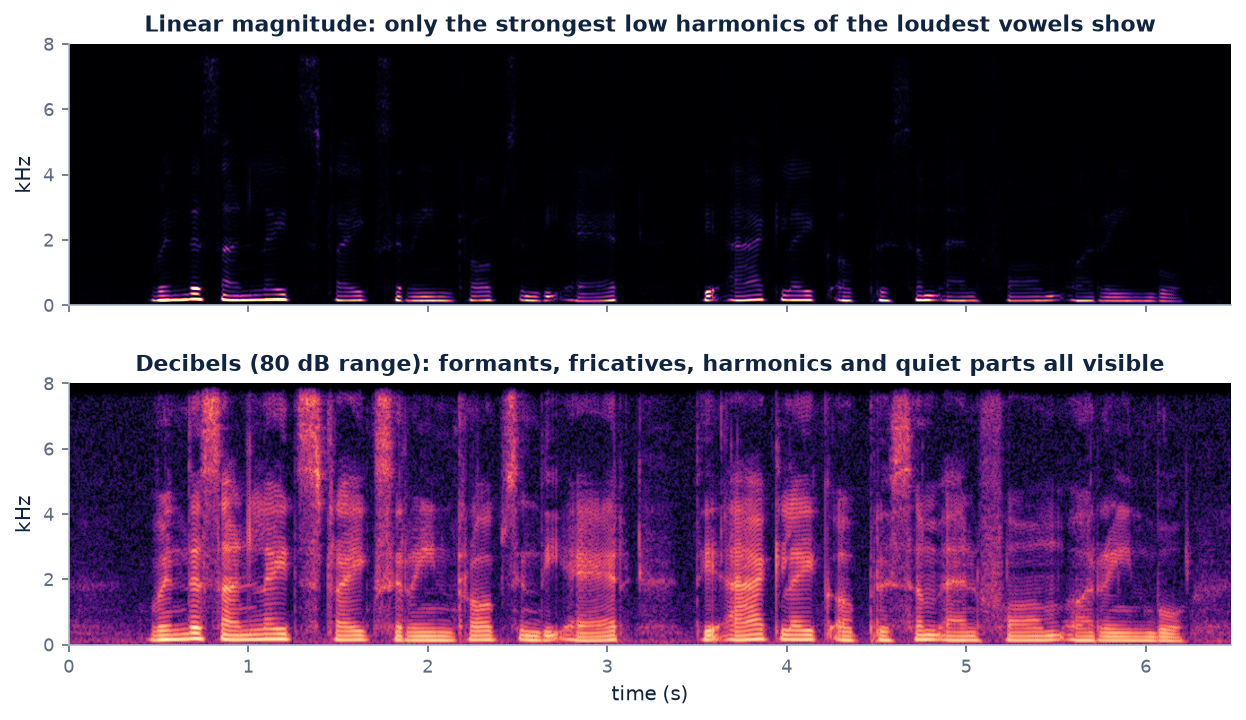
The same applies to a spectrogram, which is just many spectra side by side. Every spectrogram you have seen in this course was drawn in dB:
Figure 3. The whole recording. Top: linear magnitude (even with the colour scale saturating at half the maximum). Bottom: decibels with an 80 dB range. The
formant tracks, the fricative bands, the stop bursts and the background noise all become visible. The colour range (here 80 dB) is a choice: a smaller range hides quiet detail, a larger one shows the noise floor.
Live explorer: pick a moment, choose the scale
scale:jump to:
Click on the waveform to choose the 32 ms frame (red line).
Products become sums: the source–filter model in dB
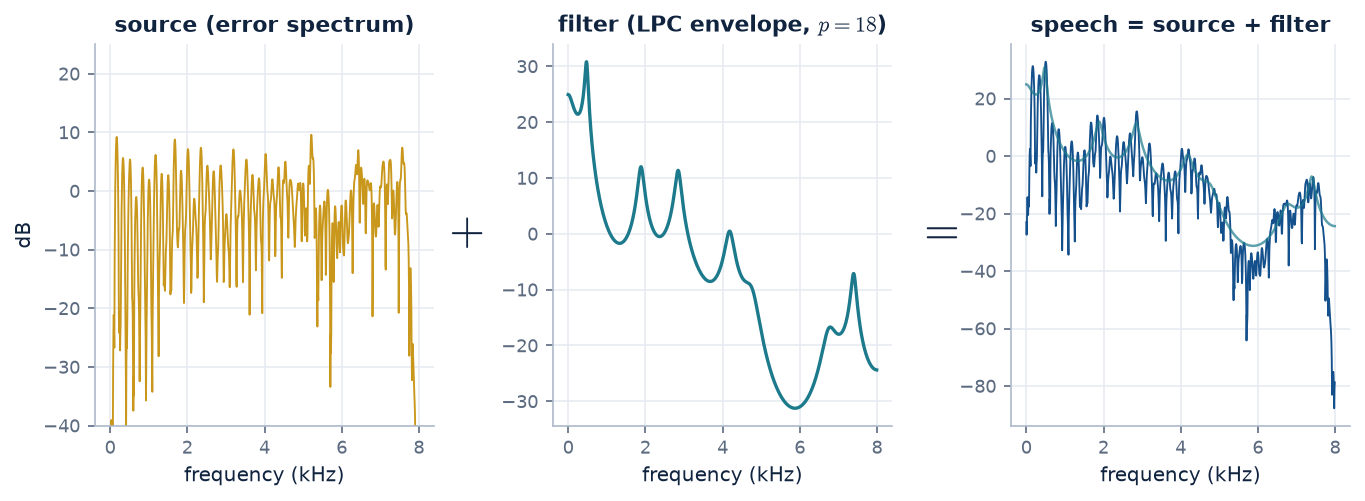
In module 3 speech was a source passed through a filter, and in the frequency domain a filter multiplies: \(X(f) = G(f)\,H(f)\). Take
\(20\log_{10}\) of the magnitudes and the multiplication becomes an addition:
Figure 4. The vowel frame of Figure 2, split with an 18th-order LPC fit (module 5). Left: the spectrum of the prediction error, a flat-ish comb of harmonics.
Middle: the all-pole envelope, the formants. Right: their sum is exactly the speech spectrum (to within a ten-thousandth of a dB). In dB the vocal tract simply adds a shape to the source.
This additive picture is behind several things you have met or will meet:
Spectral tilt is a straight line. The glottal source falls by about 12 dB per octave, and radiation from the lips adds about +6 dB per octave, so voiced speech falls by roughly 6 dB per octave. Pre-emphasis (module 5) adds +6 dB per octave back. Slopes are only straight lines in dB versus log-frequency.
Removing the filter is a subtraction. Subtracting the envelope from the log spectrum leaves the source, the idea behind the cepstrum and many pitch and formant trackers.
Machine-learning features are log spectra. Speech recognisers and audio classifiers feed networks with log (dB) spectrogram features, because the log compresses the huge range and turns channel effects (a microphone's colouring, a telephone line) into an additive offset that is easy to remove.
04 · The engineer's view
Errors, bits and budgets.
When a signal passes through a microphone, an amplifier, a codec and a network, every stage adds a little noise and scales the signal up or down. Engineers describe both with decibels.
Signal-to-noise ratio
$$\text{SNR} = 10\log_{10}\frac{\sum_n x[n]^2}{\sum_n \bigl(y[n]-x[n]\bigr)^2}\ \text{dB}$$
\(x\) is the clean signal and \(y\) the received or decoded one. The same form gives the quantisation SNR, the codec page's segmental SNR and the prediction gain (with the prediction error as the “noise”).
Reading it from the error's point of view: an SNR of \(S\) dB means the error's amplitude is \(10^{-S/20}\) of the signal's.
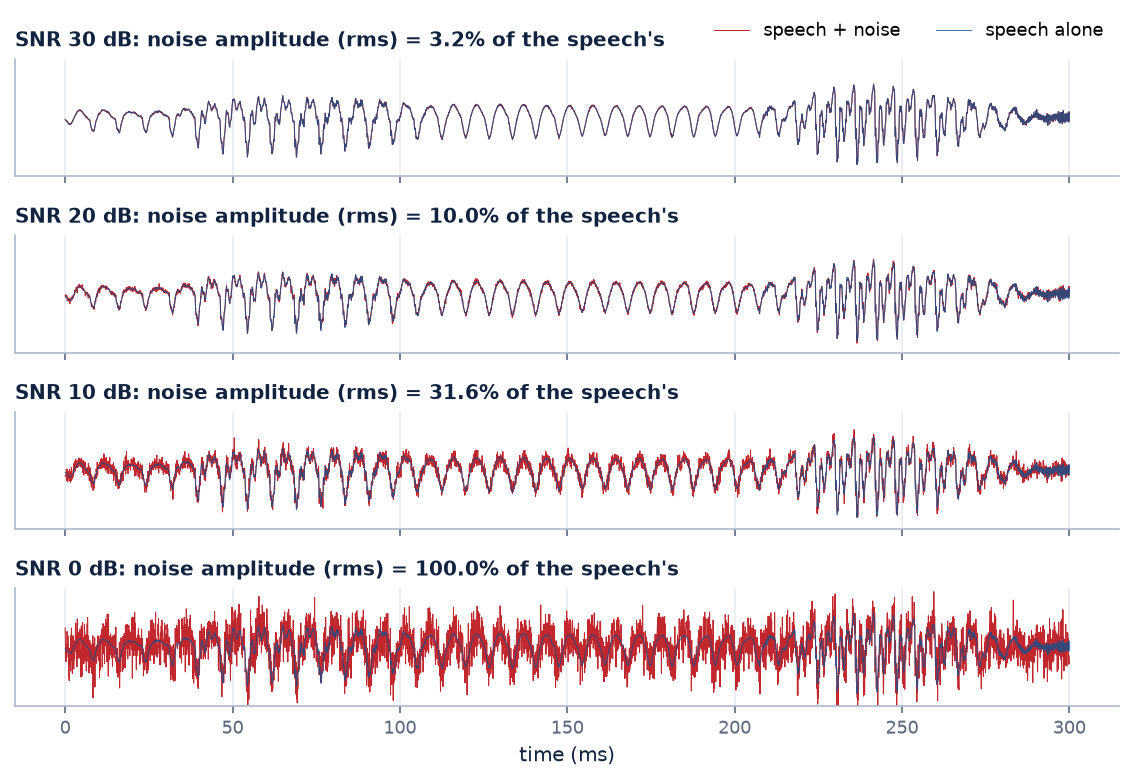
Figure 5. 300 ms of our recording (blue) with white noise added (red) at four SNRs. Each 10 dB step multiplies the noise amplitude by about 3.2. At 30 dB the noise is invisible
in the waveform but still audible in pauses; at 0 dB it is as strong as the speech.
Listen: the same recording at different SNRs
White noise is added over the whole recording, scaled so that \(10\log_{10}(\text{total speech energy} / \text{total noise energy})\) equals the chosen SNR. The noise is louder than it sounds on paper: start with your volume low.
Why “6 dB per bit” and “bits saved = gain / 6” are so simple
One more bit per sample doubles the number of quantiser levels, which halves the step and so halves the error amplitude. Halving an amplitude is always
\(20\log_{10}2 = 6.02\) dB, whatever the signal level, so every bit is worth the same 6 dB of SNR (module 6). For the same reason a predictor
with gain \(G_p\) dB makes the values to be coded \(G_p\) dB smaller, which saves about \(G_p/6\) bits. In dB, both statements are simple additions; written as ratios they would be powers of 2 and 10.
Mental arithmetic in the right-hand column, a calculator in the middle one. This is why loss and gain specifications, filter responses (“−3 dB cut-off”, “60 dB stop-band attenuation”) and link budgets are all written in dB.
A whole recording, one number, many local SNRs
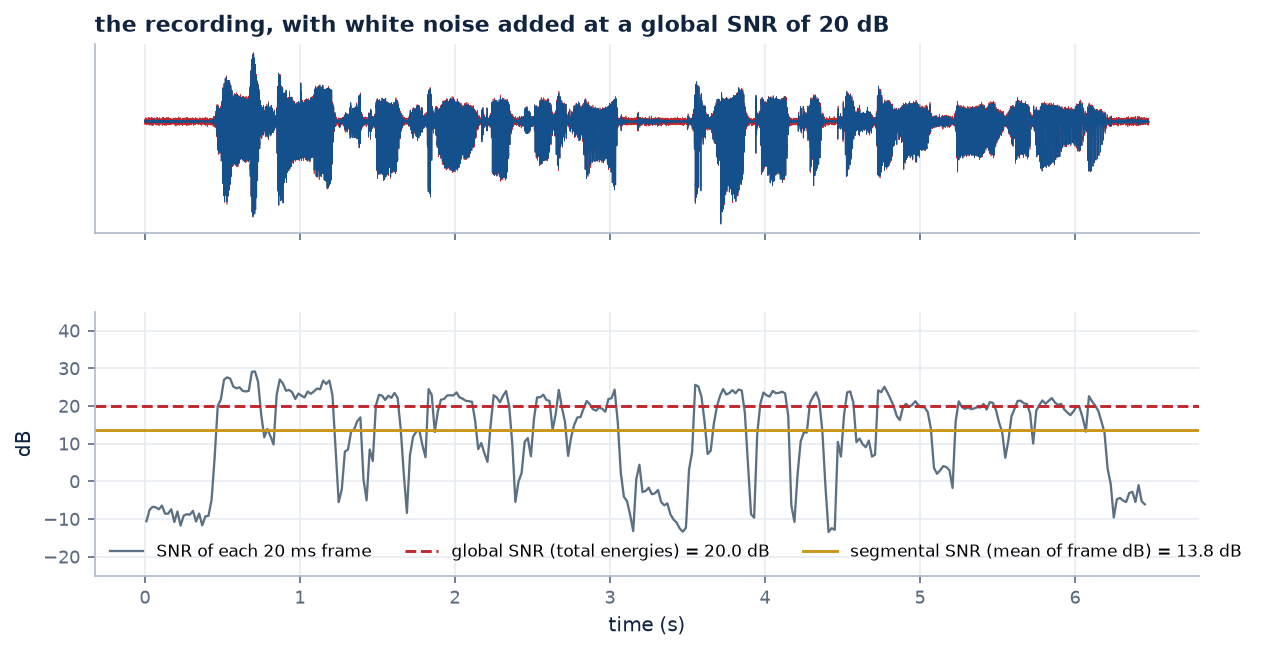
Speech is loud in vowels and near silent in pauses, so the same steady noise is far below the speech in some places and above it in others. A single global SNR hides that, which is why
module 6 reported the segmental SNR, the average of per-frame SNRs in dB:
Figure 6. White noise at a global SNR of 20.0 dB. Frame SNRs range from about 29.2 dB in the loudest vowels down to -9.6 dB in the pauses.
The segmental SNR (13.8 dB) averages the dB values, so quiet frames count as much as loud ones, closer to what a listener notices. The global SNR is dominated by the loud vowels.
05 · Traps
Four ways to get decibels wrong.
1. “The level is 60 dB”: relative to what?
A bare decibel number is a ratio with its reference missing. 60 dB SPL is conversation; 60 dB of SNR is a very clean recording; −60 dBFS is a very quiet digital signal. Always say, or ask, what the reference is.
2. Adding two sounds does not add their decibels
Two people each talking at 60 dB SPL do not make 120 dB. Decibels are logarithms, so you must convert back, add, and convert again. For two independent (uncorrelated) sounds the powers add:
$$L_{\text{total}} = 10\log_{10}\!\left(10^{L_1/10} + 10^{L_2/10}\right) \qquad 60 \oplus 60 = 63\ \text{dB}$$
two equal sounds are +3 dB (double the power). Two identical, in-phase copies add amplitudes instead, giving +6 dB, and two opposite-phase copies cancel completely: the principle of noise-cancelling headphones.
Calculator: two sources together
A useful consequence: a source 10 dB weaker than another raises the total by only 0.4 dB, and one 20 dB weaker by only 0.04 dB. The loudest source dominates, which is why reducing a weak noise source when a strong one is present achieves almost nothing.
3. The average of decibels is not the decibels of the average
Averaging dB values gives the log of the geometric mean, not of the arithmetic mean. Take two frames with the same noise power \(N\), one with SNR 40 dB (signal \(10^4 N\)) and one with 0 dB (signal \(N\)):
$$\underbrace{\tfrac12(40 + 0) = 20\ \text{dB}}_{\text{mean of dB (segmental)}} \qquad\text{vs}\qquad \underbrace{10\log_{10}\frac{10^4 N + N}{2N} \approx 37\ \text{dB}}_{\text{dB of total energies (global)}}$$
Neither is wrong: they answer different questions (Figure 6). But you must say which you computed, and never average decibels when you meant to average power.
4. Zero has no logarithm
\(\log_{10} 0 = -\infty\). Digital silence, an empty FFT bin or a perfect prediction gives \(-\infty\) dB, which breaks plots and averages. Code therefore always adds a floor, for example
20*log10(abs(X) + 1e-10), or clips at a chosen range (the “80 dB” of Figure 3). Similarly, there is no decibel of a negative number: take the magnitude or the energy first.
Decibels fit audio for three separate reasons. The ear perceives ratios over a million-to-one range. Spectra hold quiet detail next to loud peaks, and filters multiply, which the log turns into addition.
Engineering chains multiply gains and compare errors with signals, which the log turns into simple sums. One ruler, three good reasons, as long as you remember the reference and add powers, not decibels.
Check your understanding
1. A spectrum peak is at −12 dB relative to another. What is the ratio of their amplitudes, and of their powers?
Amplitude: \(10^{-12/20} \approx 0.25\) (a quarter). Power: \(10^{-12/10} \approx 0.063\) (a sixteenth). Same physical change, same 12 dB.
2. A recording peaks at −18 dBFS. How many bits of a 16-bit converter are effectively unused at the top?
−18 dB is about three halvings of amplitude (\(3 \times 6.02\) dB), so the top 3 bits are never used: the recording behaves like a 13-bit one, about 18 dB worse SNR than it could have had.
3. A fan makes 50 dB(A) in a room. You add a second identical fan. What is the new level, and does it sound twice as loud?
53 dB(A) (independent sources: powers add, +3 dB). By the “+10 dB \(\approx\) twice as loud” rule, +3 dB is a clearly noticeable but modest increase, not a doubling of loudness.
4. Why is the LPC envelope usually drawn on top of a dB spectrum, and not a linear one?
Because in dB the speech spectrum is the source spectrum plus the envelope (Figure 4), so the envelope's shape can be read off directly. On a linear axis the higher formants of the envelope would be invisible, as in Figure 2.
5. A codec has a segmental SNR of 15 dB and a global SNR of 22 dB on the same file. What does the gap tell you?
The loud frames are coded much more accurately (relative to their level) than the quiet ones. The global figure is dominated by the loud vowels; the segmental figure gives the quiet frames an equal vote and exposes their poorer SNR.